Trend
Higher highs and higher lows show demand control; lower highs and lower lows show supply control.
Technical analysis is a framework for describing price, participation, and risk—not a promise about what happens next.
Technical analysis organizes price, participation, and risk. It does not predict the future; it helps define scenarios.
These reference images support the lesson so visitors can connect the concepts to real trading screens, setups, and decision points.
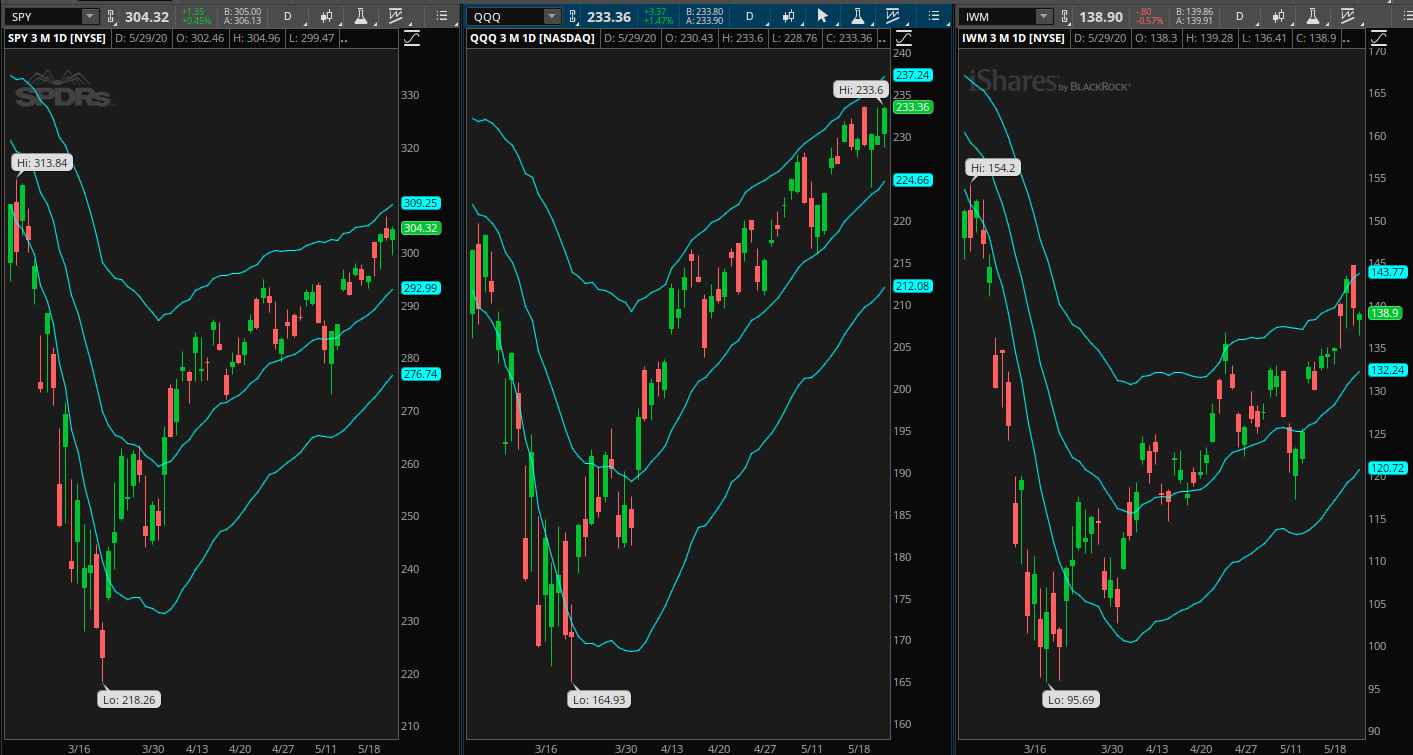
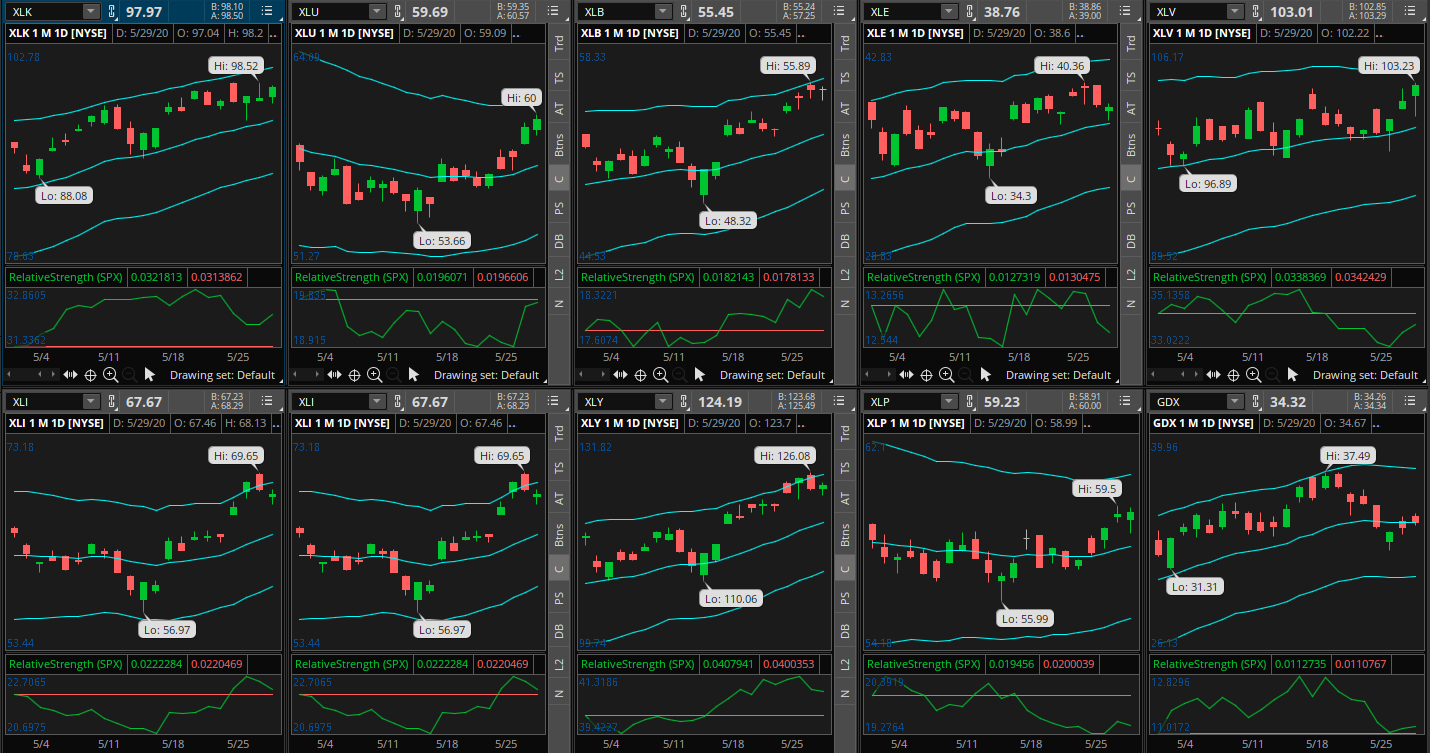
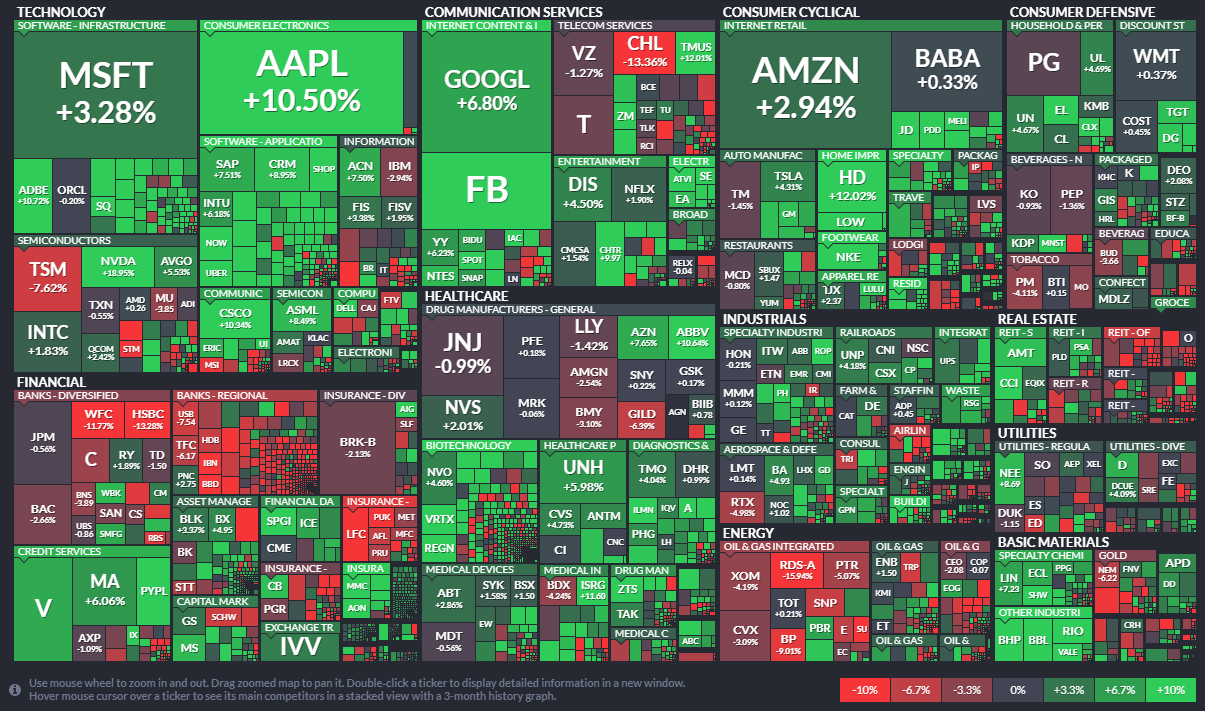

Technical analysis is a framework for describing price, participation, and risk—not a promise about what happens next.
Higher highs and higher lows show demand control; lower highs and lower lows show supply control.
Levels matter because traders remember them and orders cluster around them.
Volume shows participation. A breakout without participation is weaker.
A five-minute pattern matters more when it aligns with daily and hourly structure.
Moving averages, RSI, MACD, and VWAP support analysis but should not replace price.
The best chart idea includes the exact behavior that proves it wrong.
This second visual group sits deeper in the guide so the page teaches progressively instead of dropping every image in one place.
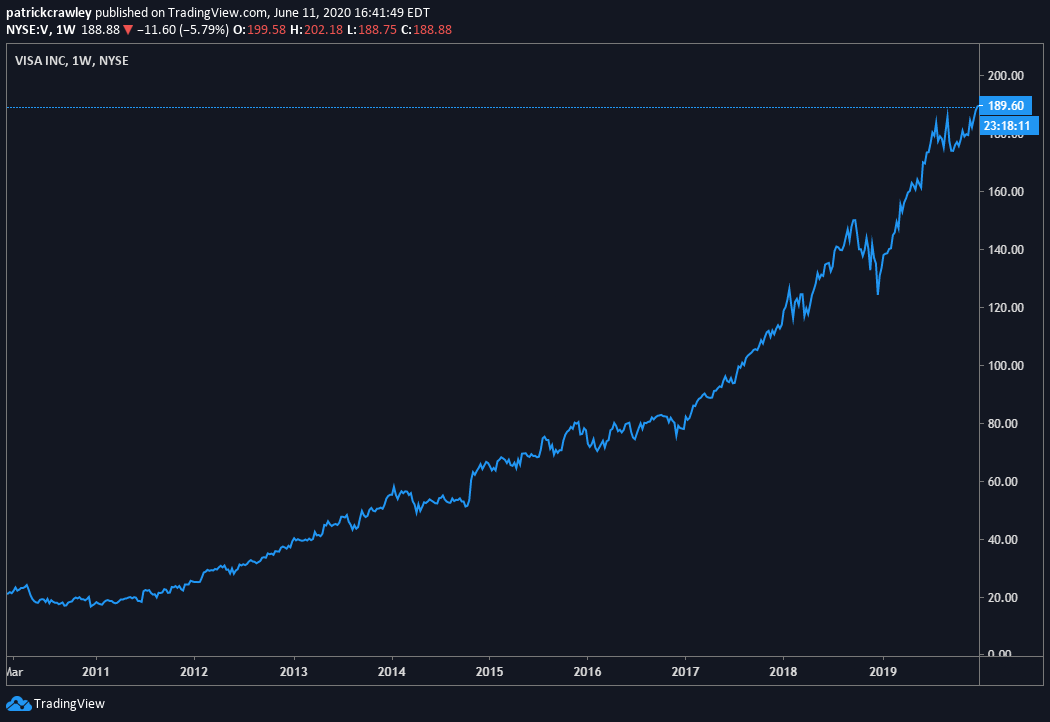
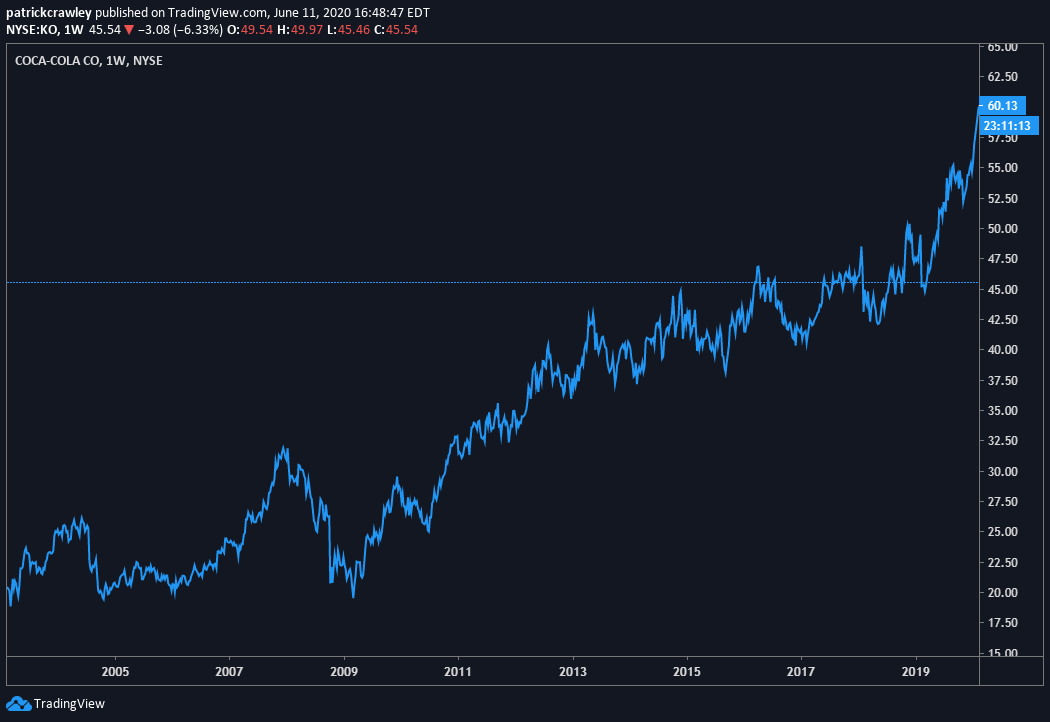
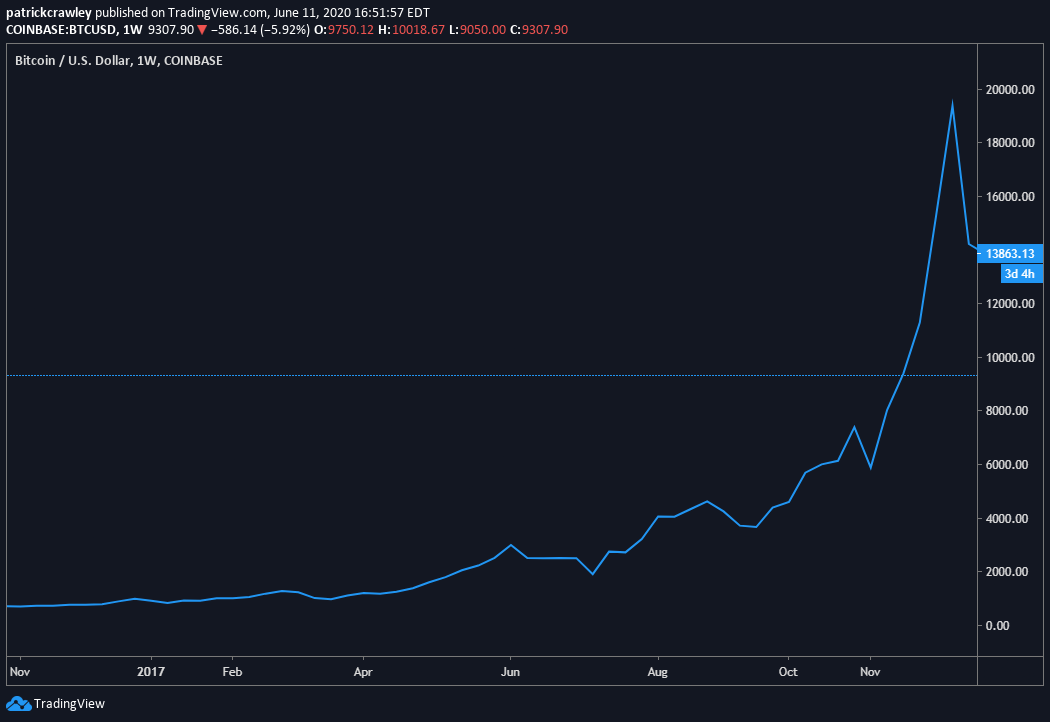
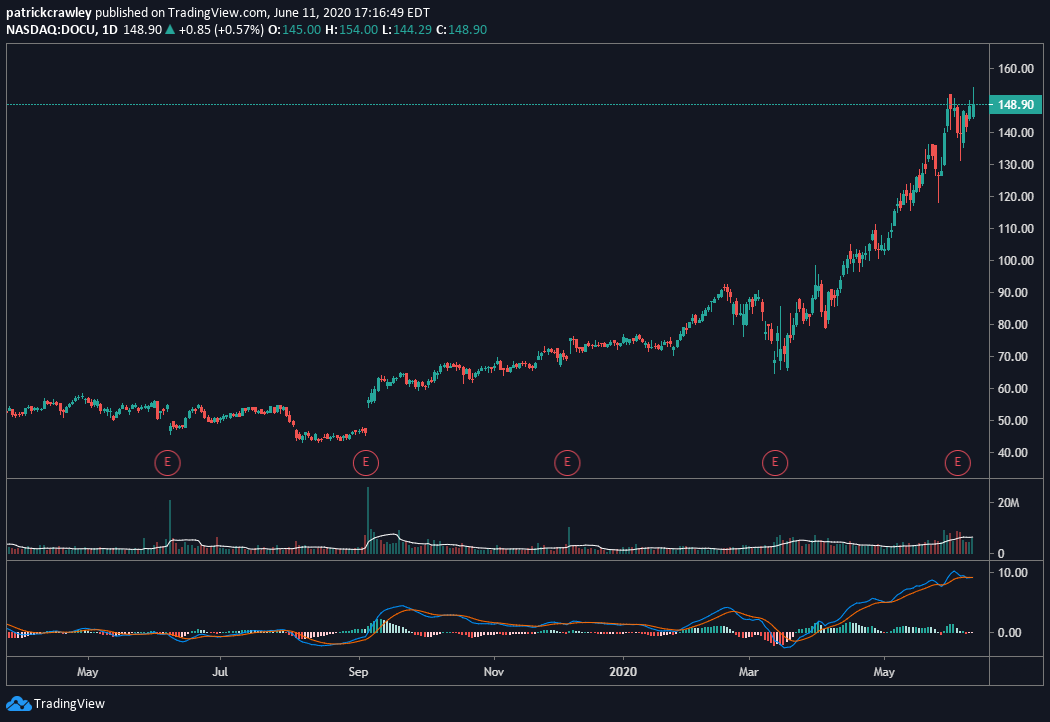
Start with the daily chart.
Mark major support and resistance.
Drop to intraday structure.
Write bullish and bearish scenarios before entry.
Study the examples after reading the framework: mark the setup, the invalidation level, and what would have made the trade worth skipping.
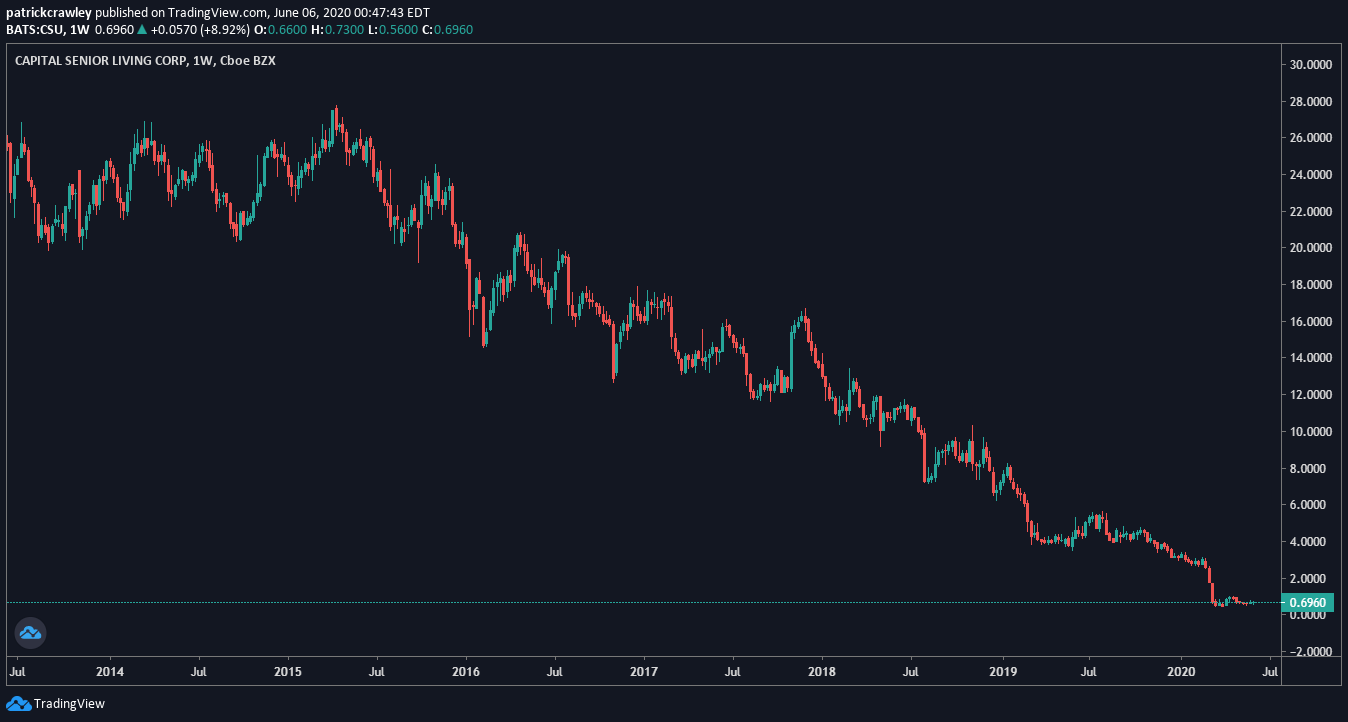
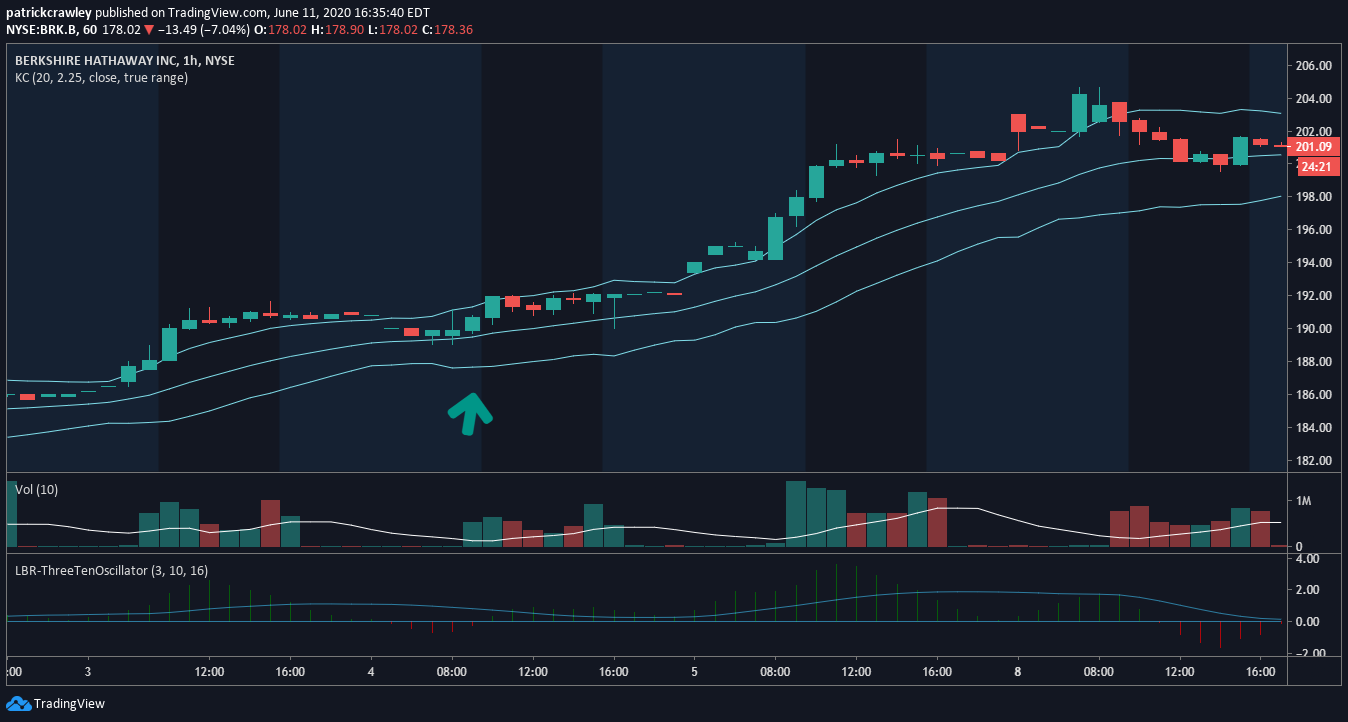
Review charts without taking trades: mark the level, predict possible behavior, then compare after the session.
Important: education should improve preparation and risk awareness, but it does not remove market risk or guarantee profit.
Trading involves risk, including the loss of capital. Use these materials for education, verify important information independently, and make decisions that fit your own circumstances.
Read the full disclaimer →